Wednesday is the big day when the Trump administration will provide more clarity on their tariff plans. The latest news has been a mix of encouraging talk about narrow reciprocal tariffs and deep and biting auto (and auto parts) tariffs. It’s tough to lay out a tariff playbook for investors right now, so our advice is to wait and see. Markets and corporate America will need time to digest the information and figure out their next move. As potential dip buyers, we’re not in a big hurry.
Markets Continue to Struggle With Tariff Uncertainty
April 2 is a big day for the stock market. There will still be trade policy uncertainty after that date, but the Trump administration is expected to clear up some of the biggest questions investors have right now. One question is whether reciprocal tariffs will be raised to cover non-tariff trade barriers. Another is whether tariffs on Mexico and Canada will be stacked up on top of auto tariffs and stick or potentially be wiped away during negotiations for USMCA 2.0. Our best guess is more the latter than the former, although some are very likely to stick, and it may take time to sort out. Either way, exemptions will be tougher to come by under Trump 2.0.
Reciprocal tariffs are broad but total only about $47 billion annually, according to calculations by Strategas’ policy research team. This is where the U.S. places the same tariffs on each country that they impose on us. If VAT taxes are included, which we believe is unlikely given Trump’s recent comment that reciprocal tariffs would be lenient, the hit would be much larger.
Auto tariffs totaling an estimated $30 billion (on estimated total auto and auto parts imports near $300 billion) will likely stick, but will, of course, have a disproportionate effect on that industry. Autos aren’t a huge part of the broad stock market — Tesla (TSLA) is only about 1.5% of the Russell 1000 Index and Ford (F) and General Motors (GM) are less than 0.2% combined.
The other sectoral tariffs on pharmaceuticals and semiconductors were delayed, but those could potentially total more than $60 billion. Tariffs already in place or announced lift the weighted average U.S. tariff rate to a range of 9–12%, according to an estimate from Evercore ISI, the highest since the 1940s. If all other proposals are put in place and no exemptions are granted (not our expectation), we’re potentially talking about tariffs approaching $300 billion, or 1% of U.S. gross domestic product (GDP). Bottom line, uncertainty is sky-high.
Trade Policy Uncertainty Is Sky High
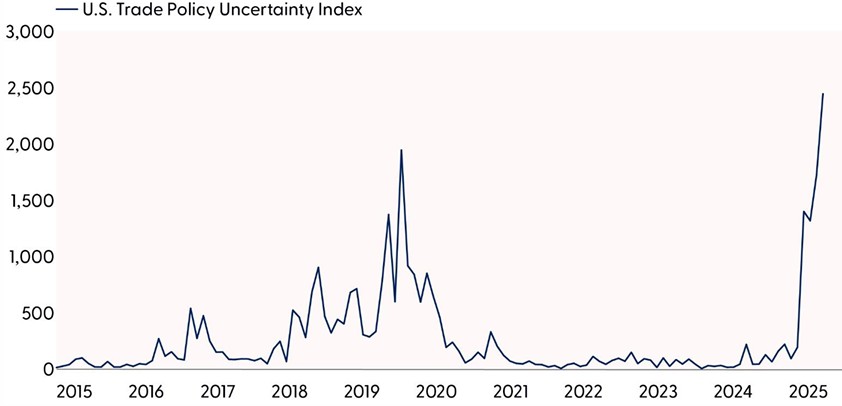
Source: LPL Research, Bloomberg, Baker, Bloom & Davis, 03/27/25
Disclosures: All indexes are unmanaged and cannot be invested in directly. Past performance is no guarantee of future results. The Trade Policy Uncertainty Index measures news reports related to trade.
The “Trade Policy Uncertainty is Sky High” chart illustrates that uncertainty was very high in 2019 around the tariff rollouts by Trump 1.0. We know markets hate uncertainty. But once it clears, stocks tend to rally. In fact, the S&P 500 gained 7% three months after the peak in trade policy uncertainty on August 31, 2019, and more than 16% until the pre-pandemic high on February 19, 2020. We don’t want to sound too bullish, and we remain cautiously neutral right now, but the opportunity for upside is there.
Scoping Potential Tariff Effects
There are several layers of tariff effects on the economy and, in turn, corporate profits. These numbers are mostly guesswork at this point, and how much of the tariff effects are mitigated remains unclear, but here are the pieces that the market is trying to size up:
- Cost increases for importers. Companies bringing goods into the U.S. will experience higher costs. Only some of those costs will be passed along to consumers who already have inflation fatigue, leading to profit margin compression. We’ll get a mix of consumer inflation and a hit to profit margins but how much of each is unclear. Higher prices will curb demand.
- Currency movements. The dollar should strengthen against the involved currencies once tariffs are put in, helping to offset some of the additional costs. This dynamic fueled the dollar’s sharp rise last fall.
- Substitute products. At some point, customers balk at higher prices importers try to pass along. In some cases, they will find products made in America that are not inflated by tariffs and limit the hit to purchasing power. However, some companies follow competitors’ price increases with their own, even on non-tariffed goods, which can make inflation stickier.
- Supply chain adjustments. It’s expensive and time-consuming to shift supply chains to avoid tariffs, though Some of that occurred during Trump 1.0. And we’ll continue to see press releases about companies producing more in the U.S. to help mitigate the effects. Korean automaker Hyundai used that playbook last week, and we’ll likely hear more of that in a couple of weeks as earnings season gets underway. These adjustments will help mitigate long-term cost pressures, but U.S. production is often more expensive, limiting the long-term benefit of the changes.
Markets Struggling With Uncertainty on Two Fronts
The U.S. economy was already poised to slow even before the tough talk on trade and tariffs from President Trump. LPL Research’s initial forecast for U.S. GDP growth of 1.9% in 2025 back in early December was already below consensus at that time due to our views on consumer spending and personal income growth. After the weak retail sales numbers for both January and February, we reduced our growth estimate to 1.7% with downside risks from potential trade wars. The economy may sputter from an additional drag on economic activity from tariffs. It’s not just companies paying tariffs that impact the economy. Capital investments are being delayed. Consumer purchases are being put off due to a potential trade war, negative wealth effects from lower stock prices, and a softer job market. But as we consider current conditions, consumers have the benefit of a healthy stock of savings, years of solid income growth, and accumulated net wealth.
That doesn’t diminish the fact that markets currently face two big challenges at the same time. A slowing economy would have already caused recession fears to increase. Our recession odds for the next 12 to 18 months are now at 30%. Add in tariff uncertainty, which has dented consumer confidence, and you have the recipe for a jittery market. As economic growth expectations have weakened, with economic data increasingly missing expectations in recent weeks, stocks have fallen.
Stock Market Weakness Has Accompanied Weakening Economic Growth Expectations
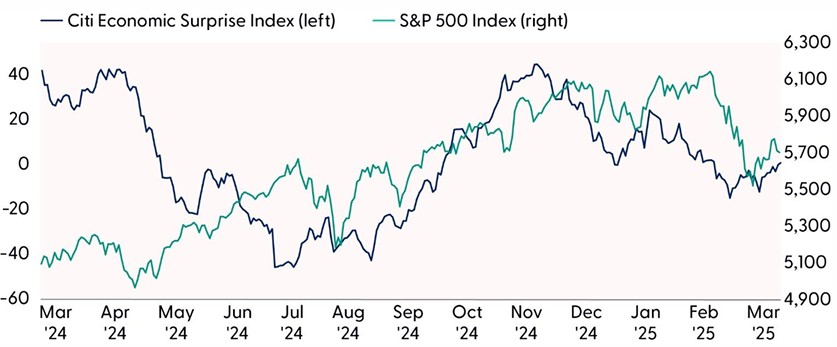
Source: LPL Research, Bloomberg, FactSet, 03/27/25
Disclosures: The Citi Economic Surprise Index is a measure of the frequency with which economic data points exceed or miss consensus estimates on a scale between -100 and +100.All indexes are unmanaged and cannot be invested in directly. Past performance is no guarantee of future results.
Expect Earnings Estimates to Come Down in Short Order
We remain perplexed by how well earnings estimates for 2025 have held up over the last two months amid not only the flurry of tariff headlines but also building evidence of an economic slowdown. The glass-half-full reason may be analysts’ confidence that artificial intelligence (AI) investment dollars will keep flowing. The Magnificent Seven are expected to invest well over $300 billion in AI this year — most of it by the big four hyper-scalers Alphabet (GOOG/L), Amazon (AMZN), Meta (META), and Microsoft (MSFT). That spending will translate into revenue for NVIDIA (NVDA) and others.
While technology spending is part of the story, we believe analysts are just waiting for more clarity on tariffs. Expect the latest consensus estimate for S&P 500 earnings per share (EPS) near $269 to fall in the weeks ahead. Companies have started to guide estimates down some, which will be more frequent in late April through May during the bulk of earnings season. For now, we feel good about our $260 estimate (an 8% increase), factoring in a couple points of downside from tariffs, with slightly more downside risk than upside potential.
Some Tariff Effects Have Started to Show Up in Earnings Estimates
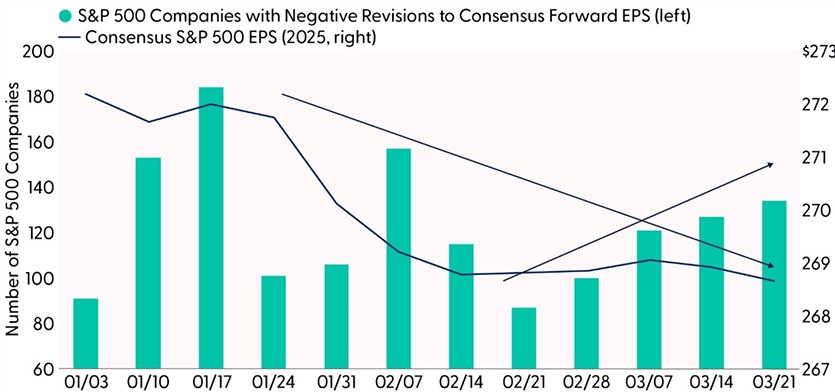
Source: LPL Research, FactSet, 03/27/25
Disclosures: All indexes are unmanaged and cannot be invested in directly. Past performance is no guarantee of future results. Forecasts may not develop as predicted and are subject to change.
Tough Start to 2025 for Stocks Could Be a Sign of More Volatility to Come
Barring one of the biggest rallies of all time on Monday, the S&P 500 will end the first quarter lower. Since 1950, when the S&P 500 has finished the first quarter lower, the average and median rest-of-year returns have been 2.4% and -1.1%, with only 48% of years producing positive results (for positive Q1s, rest-of-year gains average over 9% and the index is positive 88% of the time).
LPL Research expects stocks to do better than the 2.4% (or -1.1%) this year, but our below-consensus forecast for the S&P 500 (6,275–6,375) does reflect trade war concerns and slower economic growth. The key to the year will be how much spinach markets must eat (tariffs) before the candy comes later (tax cut extensions, deregulation, and more Federal Reserve [Fed] rate cuts). We believe the economy is on good enough footing to handle this sequencing challenge, but that doesn’t mean stocks will go straight up after April 2. Expect stocks to remain volatile until the trade policy fog clears and markets start paying more attention to the reconciliation process that will pave the way for an extension of most of the 2017 Trump tax cuts. That could easily take another month or two.
Negative First Quarter Suggests a Lackluster 2025 for Stocks
S&P 500 Performance from April Through December Based on Positive or Negative Q1 (1950–2024)
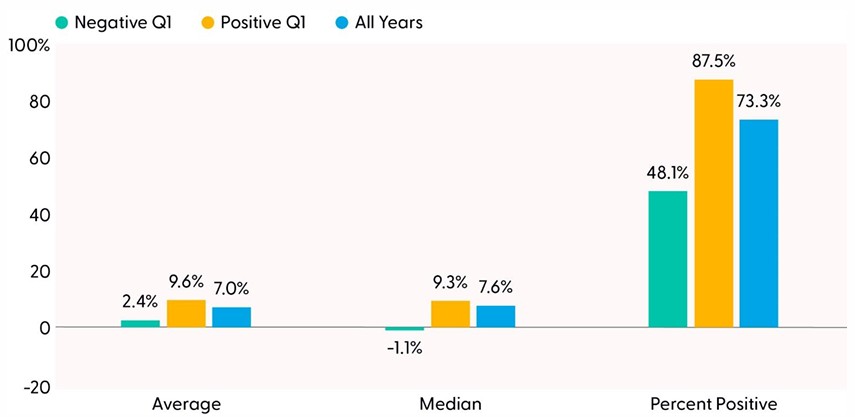
Source: LPL Research, Bloomberg, FactSet 03/27/25
Disclosures: All indexes are unmanaged and cannot be invested in directly. Past performance is no guarantee of future results.
Conclusion
Markets are facing significant tariff uncertainty right now, but that fog will soon start to clear. Historically, periods of policy uncertainty have been followed by stock market gains. The economy is slowing but remains in relatively good shape, with low unemployment and rising incomes. Signs of recession are tough to find despite weakening consumer and business confidence. Corporate profits are still rising. The Fed is still cutting rates. Tariff inflation is probably “transitory.” Tax cuts will be extended (though to what degree and for how long is tough to say). Get ready to buy the dip, but just don’t be in too big of a hurry.
Asset Allocation Insights
LPL’s Strategic and Tactical Asset Allocation Committee (STAAC) maintains its tactical neutral stance on equities, with a preference for the U.S. over emerging markets, growth over value, and large caps over small. The Committee does not rule out the possibility of additional short-term weakness, as the pace of growth is cooling, and trade policy and geopolitical uncertainty remain high. While the risk-reward trade-off for beaten-down stocks has improved at lower prices, a swift and sustainable recovery — even after this week’s tariff announcements — seems unlikely under the cloud of trade uncertainty. LPL Research continues to monitor tariff news, economic data, earnings estimates, and various technical indicators to identify a potentially attractive entry point to add equities.
Within fixed income, the STAAC holds a neutral weight in core bonds, with a slight preference for mortgage-backed securities (MBS) over investment-grade corporates. In our view, the risk-reward for core bond sectors (U.S. Treasury, agency mortgage-backed securities, investment-grade corporates) is more attractive than plus sectors. We believe adding duration isn’t attractive at current levels, and the STAAC remains neutral relative to our benchmarks.
Important Disclosures
This material is for general information only and is not intended to provide specific advice or recommendations for any individual. There is no assurance that the views or strategies discussed are suitable for all investors or will yield positive outcomes. Investing involves risks including possible loss of principal. Any economic forecasts set forth may not develop as predicted and are subject to change.
References to markets, asset classes, and sectors are generally regarding the corresponding market index. Indexes are unmanaged statistical composites and cannot be invested into directly. Index performance is not indicative of the performance of any investment and do not reflect fees, expenses, or sales charges. All performance referenced is historical and is no guarantee of future results.
Any company names noted herein are for educational purposes only and not an indication of trading intent or a solicitation of their products or services. LPL Financial doesn’t provide research on individual equities.
All information is believed to be from reliable sources; however, LPL Financial makes no representation as to its completeness or accuracy.
All investing involves risk, including possible loss of principal.
US Treasuries may be considered “safe haven” investments but do carry some degree of risk including interest rate, credit, and market risk. Bonds are subject to market and interest rate risk if sold prior to maturity. Bond values will decline as interest rates rise and bonds are subject to availability and change in price.
The Standard & Poor’s 500 Index (S&P500) is a capitalization-weighted index of 500 stocks designed to measure performance of the broad domestic economy through changes in the aggregate market value of 500 stocks representing all major industries.
The PE ratio (price-to-earnings ratio) is a measure of the price paid for a share relative to the annual net income or profit earned by the firm per share. It is a financial ratio used for valuation: a higher PE ratio means that investors are paying more for each unit of net income, so the stock is more expensive compared to one with lower PE ratio.
Earnings per share (EPS) is the portion of a company’s profit allocated to each outstanding share of common stock. EPS serves as an indicator of a company’s profitability. Earnings per share is generally considered to be the single most important variable in determining a share’s price. It is also a major component used to calculate the price-to-earnings valuation ratio.
All index data from FactSet or Bloomberg.
This research material has been prepared by LPL Financial LLC.
Not Insured by FDIC/NCUA or Any Other Government Agency | Not Bank/Credit Union Guaranteed | Not Bank/Credit Union Deposits or Obligations | May Lose Value
For public use.
Member FINRA/SIPC.
RES-0003080-0225 Tracking #715963 | #715965 (Exp. 03/26)