First and foremost, this week’s commentary should not be construed to suggest that we are saying stocks will go up forever. We are also not saying that stocks are immune from a pullback in the final four months of 2021. Corrections are a normal part of investing and the S&P 500 Index has yet to pull back even 5% so far this year, something that happens on average three times per year. However, we remain steadfastly bullish and this week want to explore five things that some bears believe that do not worry us.
Bear Argument #1: Equities Have Gone Too Far, Too Fast
2021 has been an amazing year for stocks, with the S&P 500 up approximately 20% for the year without so much as a 5% pullback. Additionally, it has made 52 new all-time highs so far. To put in context how rare this is, only 1964 and 1995 saw more than 50 new highs before August was over. In fact, the all-time record for new highs in one year is 77, set in 1995, and this year is on pace to come very close to that record.
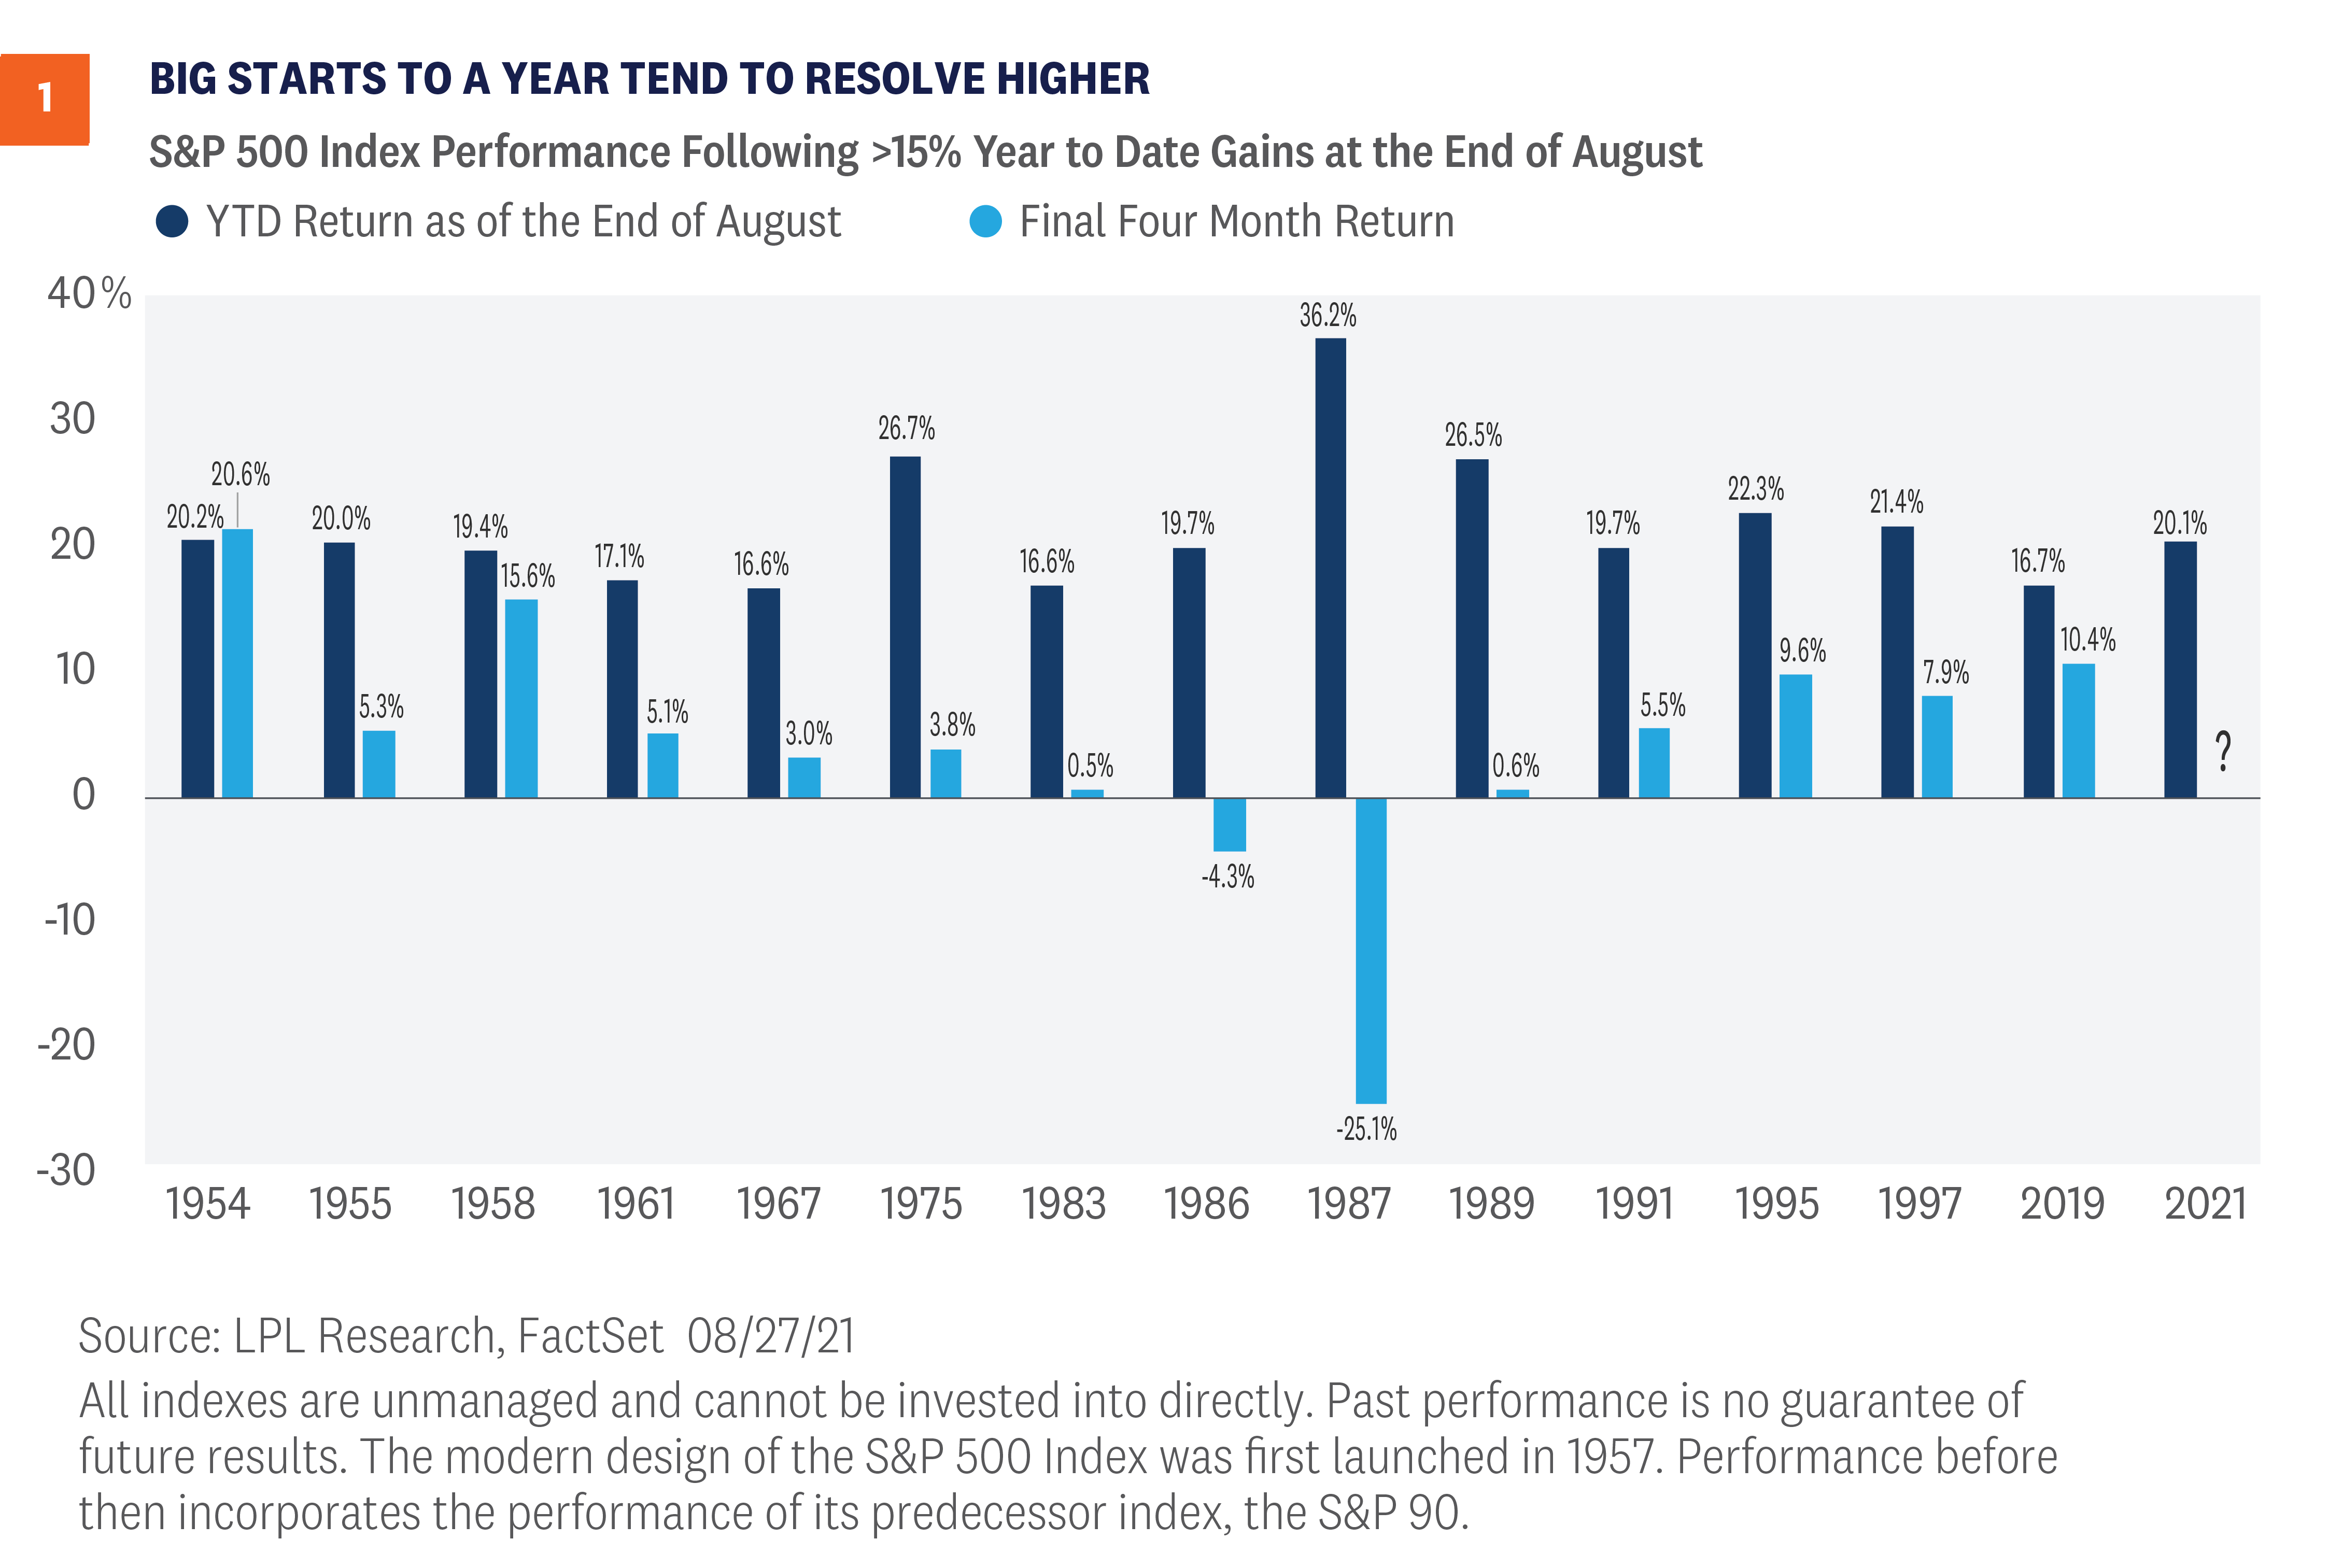
What should investors do now? One of the common bear worries is stocks moving up a lot means stocks will come down a lot. That simply isn’t true, fortunately. In fact, as [Figure 1] shows, when the S&P 500 is up more than 15% year to date at the end of August (as 2021 likely will be), the final four months have been up the past five times, with the last three up 9.6%, 7.9%, and 10.4%, respectively. In fact, the average return in the final four months after a great start to the year is 4.2%, with a very impressive median return of 5.2%. Both numbers are above the average, and the median return for all years during the final four months is 3.6%.
Bear Argument #2: Strong Earnings Have Just Been Due To Easy Comps
The economy’s remarkable stimulus-aided recovery from the swift but severe pandemic recession of 2020 set the stage for a tremendous earnings surge that has been going on for a year now. And it is true that a good portion of that growth was due to the lockdowns in the year-ago quarter boosting the growth rate. But that isn’t the whole story—not even close. Our S&P 500 earnings per share (EPS) estimates for 2021 is now $205, up 46% from $140 in 2020 and—even more impressively—26% above the pre-pandemic level of $163 in 2019. These earnings gains have prevented stocks from getting more expensive this year, as the price-to-earnings ratio for the S&P 500 has held steady despite the index’s 20% year-to-date advance.
In our second-quarter earnings preview, we posed the question, “Is this as good as it gets?” The answer is almost certainly yes, as the 90% second-quarter growth rate probably won’t be duplicated for a long time. However, we expect earnings to grow at a very solid pace of over 20% in the third and fourth quarters. Companies generally provided optimistic outlooks during earnings season with 58% of the guidance being positive compared with the 5-year average of 37%, which we believe increases the likelihood of better-than-expected results for the next quarter or two. We can’t entirely dismiss the risks, including the Delta variant, supply chain disruptions, and inflation pressures—particularly wages. But we expect corporate America’s efficiency and the strength of the reopening to continue to power earnings ahead and lead to additional gains for stocks over the rest of 2021.
Bear Argument #3: Cyclical Stocks Are Flashing a Warning Sign
It is true that cyclical stocks have largely underperformed the market over the past several months. The Dow Jones Transportation Average topped out in early May, while areas like banks and small caps have been going sideways for even longer. However, the context of these moves is lost when looking purely at recent performance. All of these sectors and asset classes have seen sideways action following historic runs from Q4 2020 into the early part of this year. However, despite recent underperformance, all of these groups remain above upward-sloping 200-day moving averages, a sign that the uptrends are firmly intact.
We believe that recent underperformance is simply working off extreme overbought conditions, but those conditions are bullish over the longer-term. Perhaps most importantly though, we are seeing signs that this underperformance may be coming to an end. Last week, small caps outperformed large by the most since March. Banks have seen an expansion in new highs, and airlines, which have been one of the biggest drags on transports over recent months, are actually up 8% over the past six weeks despite fears surrounding Delta.
The final variable to watch may be interest rates, which are highly correlated with cyclical and small-cap outperformance. We believe the yield on the 10-year Treasury has seen the bottom and is poised to continue higher through year-end.
Bear Argument #4: A Taper Tantrum is Coming
According to recent investor surveys, equity and fixed income investors are worried about a potential “taper tantrum” when the Federal Reserve (Fed) starts to reduce its bond-buying programs. As a reminder, in 2013, Fed Chairman Ben Bernanke casually mentioned that the Fed would start to reduce (taper) its bond buying programs in the coming months. His comments caught equity and fixed income investors by surprise and both markets reacted negatively—although the equity markets went on to return 30% for the year. While we are in a similar situation today with the Fed ready to announce its intentions to taper its bond buying programs, the markets have no reason to be surprised. The Fed has been communicating its intentions to eventually taper bond purchases for several months now. Markets should be well prepared at this point as the Fed learned its lesson from 2013 and has done a much better job communicating its intentions.
Moreover, we think we are still several years away from full monetary normalization. After tapering ends, the Fed will likely wait some time before it starts to raise short-term interest rates. Last time we were in this position (in 2013), it was two years before the Fed began to increase interest rates, which took place over a four-year horizon. Former Fed Chair William McChesney Martin famously quipped that the job of the Federal Reserve is “to take away the punch bowl just as the party gets going.” We don’t think the current Fed is going to take away the punch bowl anytime soon, and expect it will remain accommodative for the foreseeable future.
Bear Argument #5: The White House Agenda Will Derail The Bull
We don’t think Washington policy developments are a serious threat to broad markets in the near-to-medium term. We know that people get passionate about policy and that’s a good thing—that’s what makes a democracy go. But a direct connection between policy and broader market direction is rare. Even when it comes to the narrow impact of policy on an individual sector or industry, the outcome for markets may not be in line with what conventional wisdom expects—or may be overwhelmed by larger economic forces.
Policy does matter, but unless there’s a glaring mistake, it’s unlikely to be a policy decision that takes the bull market down. President Biden’s agenda is likely a mixed bag for markets. Markets tend to respond positively to stimulus, and we believe we may see a total of $2–2.5 trillion in new spending, spread out over about 10 years, passed by the end of the year. But higher taxes could be a headwind, and that additional spending may be paid for, in part, by $1–1.5 trillion in new taxes, the rest coming through borrowing. But either way the primary driver of the recovery will continue to be businesses looking for better ways to compete, innovate, and grow. That’s a powerful force, and market history says compared to that what happens in Washington is usually not enough of a catalyst to reverse market momentum.
Conclusion
LPL Research continues to believe that tactical investors should tilt portfolios in favor of stocks over bonds. This certainly does not mean that an exogenous shock could not cause stocks to correct. However, when looking at the recent pace of earnings, the policy environment, and market history, we fail to see a compelling bear case against equities.
Click here to download a PDF of this report.
IMPORTANT DISCLOSURES
This material is for general information only and is not intended to provide specific advice or recommendations for any individual. There is no assurance that the views or strategies discussed are suitable for all investors or will yield positive outcomes. Investing involves risks including possible loss of principal. Any economic forecasts set forth may not develop as predicted and are subject to change.
References to markets, asset classes, and sectors are generally regarding the corresponding market index. Indexes are unmanaged statistical composites and cannot be invested into directly. Index performance is not indicative of the performance of any investment and do not reflect fees, expenses, or sales charges. All performance referenced is historical and is no guarantee of future results.
Any company names noted herein are for educational purposes only and not an indication of trading intent or a solicitation of their products or services. LPL Financial doesn’t provide research on individual equities.
All information is believed to be from reliable sources; however, LPL Financial makes no representation as to its completeness or accuracy.
U.S. Treasuries may be considered “safe haven” investments but do carry some degree of risk including interest rate, credit, and market risk. Bonds are subject to market and interest rate risk if sold prior to maturity. Bond values will decline as interest rates rise and bonds are subject to availability and change in price.
The Standard & Poor’s 500 Index (S&P500) is a capitalization-weighted index of 500 stocks designed to measure performance of the broad domestic economy through changes in the aggregate market value of 500 stocks representing all major industries.
The PE ratio (price-to-earnings ratio) is a measure of the price paid for a share relative to the annual net income or profit earned by the firm per share. It is a financial ratio used for valuation: a higher PE ratio means that investors are paying more for each unit of net income, so the stock is more expensive compared to one with lower PE ratio.
Earnings per share (EPS) is the portion of a company’s profit allocated to each outstanding share of common stock. EPS serves as an indicator of a company’s profitability. Earnings per share is generally considered to be the single most important variable in determining a share’s price. It is also a major component used to calculate the price-to-earnings valuation ratio.
All index data from FactSet.
Please read the full Midyear Outlook 2021: Picking Up Speed publication for additional description and disclosure.
This research material has been prepared by LPL Financial LLC.
Securities and advisory services offered through LPL Financial (LPL), a registered investment advisor and broker-dealer (member FINRA/SIPC). Insurance products are offered through LPL or its licensed affiliates. To the extent you are receiving investment advice from a separately registered independent investment advisor that is not an LPL affiliate, please note LPL makes no representation with respect to such entity.
Not Insured by FDIC/NCUA or Any Other Government Agency | Not Bank/Credit Union Guaranteed | Not Bank/Credit Union Deposits or Obligations | May Lose Value
RES-873950-0821 | For Public Use | Tracking # 1-05184665 (Exp. 08/22)